Using the Computer to Graph a Function
Let’s use the tools on Dr. Ongard’s College Algebra web site to graph the function given in practice exercise 29 in Unit 4.
1. On the CMS web page, select Faculty>Ongard Sirisaengtaksin>College Algebra or just enter the following URL.
http://cms.dt.uh.edu/Faculty/OngardS/CollegeAlgebra.htm

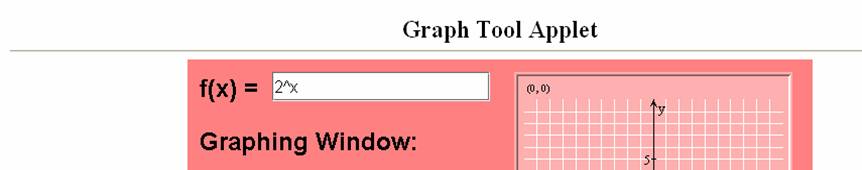
2. Select GraphFunction.
Enter the function formula for problem 29 in the box following the label “f(x)” as follows.
[Only the variable x can be used; multiplications must be explicitly entered using *; exponents are indicated
by separating the base and exponent by the symbol ^ , Shift + 6; square roots can be entered by using the exponent 1/2]
2^x
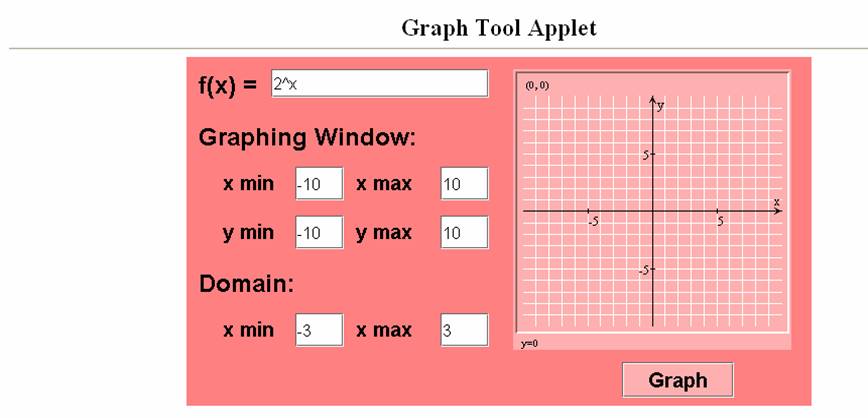
3. Choosing the Graphing Window is a trial-and-error process. Study Unit 4 for more information.
Let’s start with the default setting x min = -10, x max = 10, y min=-10, y max=10.
These numbers are the bounds on the horizontal and vertical axes.
The boxes that appear in the screen below Domain are to be used for a function with an application domain.
Since the function in problem 29, has an application domain specified by the interval -3 < z < 3, you must enter x min = -3 and x max = 3 as shown below. The computer does not add open or filled dots to start or end a graph with an application domain; that is left for you to do.
If the function to be graphed has no application domain, then it is recommended that the same x min and x max values be used in the boxes in the Graphing Window and in the boxes below Domain.
4. Finally, to have the computer make the graph, just select (click on) Graph.
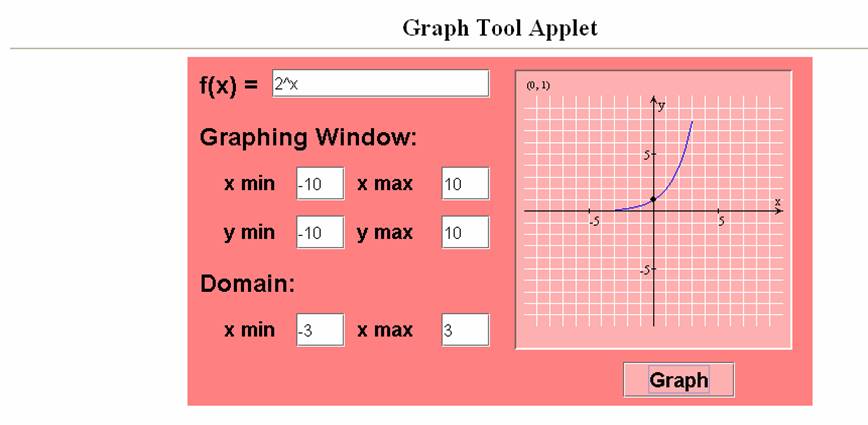
4. You may need to adjust the Graphing Window if you do not have a good graph or if you just want the Graphing Window to better display the graph.
For example, since the application domain is from -3 to 3, the graph may look better by reducing the x-axis in the Graphing Window to x min = -5 and x max = 5. Also, there are no negative outputs for this function, and so the graph may also look better by reducing the y-axis in the Graphing Window to y min = -1 and y max = 10.
Here is the new graph.
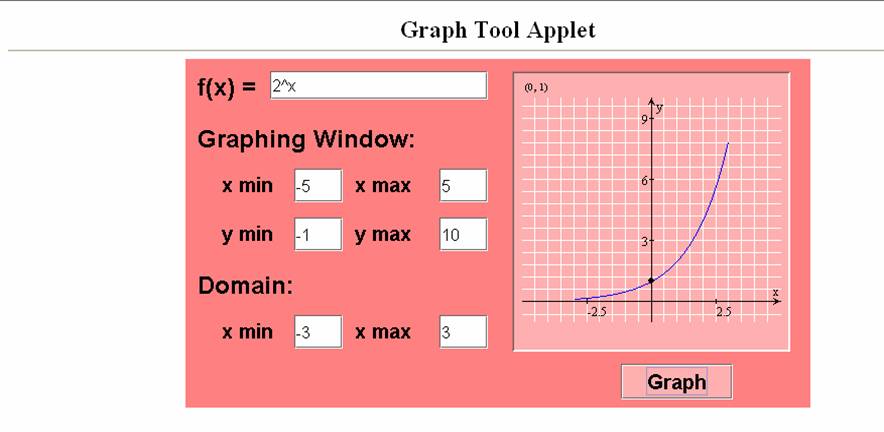
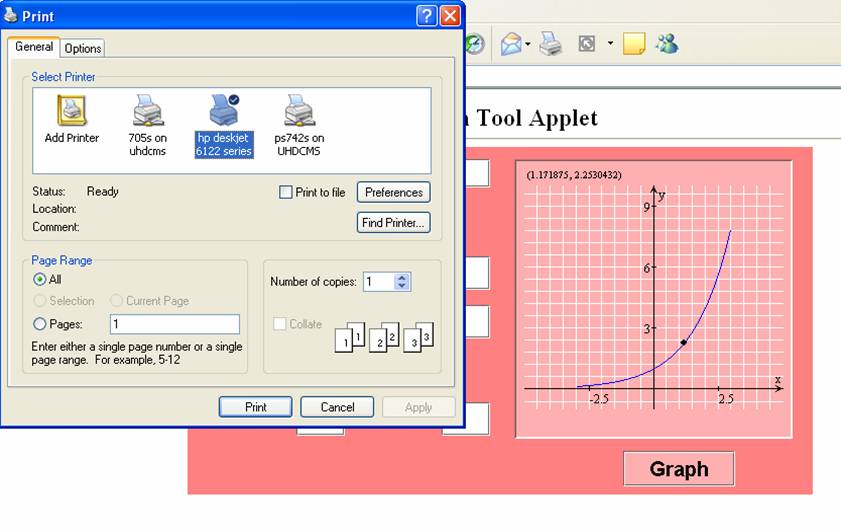
Note that there is a trace feature. Click the cursor anywhere in the graphing window on the right side of the screen and then press the up-arrow key or the down-arrow key to trace along the graph. The matching coordinates of the point appear in the upper left corner of the graphing window.
If you print the graph first, then you can come back and trace on the computer and write better approximations on your printout of intercepts, maximum outputs, minimum outputs, etc.
5. To get a printout
of your graph, select the menu choices File>Print>Print.
Please let me know if you have any questions or difficulties using this graphing tool.