Class
Journal - Math 1301 (20984)
Spring 2008
What I hear, I
forget; what I see, I remember; what I do, I understand. – Kung Fu
Tzu (Confucius)
One learns the thing by doing the thing; for though you think you know
it,
You have no certainty until you try. – Sophocles
|
Session |
Date |
Read & Study Section |
Discussion Topics |
Practice Exercises |
Other Info |
|
|
5 - 1 |
|
Final
Exam (comprehensive) Thursday,
May 1, 8:30 – 11 AM Bring
a #2 pencil and a scientific calculator. |
|
You may get information about Final Exam Review sessions and download a copy of the Final Exam Review at the UHD Algebra Student web site http://cms.uhd.edu/qep/algebra |
|
28 |
4 - 24 |
5.3 5.4 |
Section 5.3&5.4 Every power of 2 is a positive number – no
power of 2 equals zero and no power of 2 equals a negative number. Therefore log2(-8)
is not a real number because there is no exponent on 2 that gives a negative
number and the domain of the log function y=log2 (x) are the
positive numbers. Note: (1) a function and its inverse undo each other, that
is, f -1(f(x))=x; (2) the inverse of the function f(x)=(b)x
is f -1(x)= logb x and so logb(b)x=x.
Look at this last equation closely: logs can be used to bring the exponent x
down. This property is helpful in solving equations where the variable is
an exponent: take the log of each side to help solve the equation. Study
example 12 on page 428. There are many applications of exponential and
logarithm functions – study the examples in sections 5.3 and 5.4. |
See below. |
Have you been contacted by UHD to complete the NSSE survey? Click here for more information and a chance to win an i-pod. |
|
27 |
4 - 22 |
5.3 5.4 |
Numbers
are used to measure and quantify data. Functions are used to model and
describe the relationship between the input quantity and output quantity. Section 5.3 If the initial output of a function is 3
and the output doubles per unit increase in x, this information is captured
by the exponential function f(x)=3(2)x. The general formula
of an exponential function is f(x)=C(a)x where the
coefficient C is the initial value of the function when x=0 and the base a is
the multiplier of the output y per unit increase in x. See page 400. Note:
(1) when the base a>0, the function
increases and the graph rises from left to right – called exponential
growth; (2) when the base
0<a<1, the function decreases and the graph falls from left to right –
called exponential decay. See the properties of exponential function
graphs on pages 403-404. By the order of operations, exponents are
done before multiplication and so f(2)=3(2)2=3(4)=12. You should
review special exponents in this section: (2)0=
1 ; (2)-3=1/(23)=1/8;
(4)3/2=(sqrt(4))3=23=8; (1/2 )-1=(2/1)
1=2; (1/2 )-2=(2/1)2=4. Carefully study the
examples in section 5.3. See page 408: the most special base of an
exponential function is the number e≈2.72. Section 5.4 Every exponential function f(x)=C(a)x
is one-to-one and so has an inverse. The inverse of the exponential function
f(x)=bx with base b is the logarithm function with base b
which is written as logb x “log base b of x”. Note (1) inverse
functions switch inputs and outputs; (2) the input to an exponential function
is an exponent; (3) the output from a logarithm is an exponent. Let’s repeat
this: logarithms are exponents. Therefore log2 8 equals the
exponent on the base 2 that gives 8 and so log2 8 = 3. The most
special bases of logarithm functions are base 10 called the common
logarithm and base e called the natural logarithm. Study the
examples in section 5.4. |
Section
5.3 # 1-17 odd, 18, 19, 25, 31, 41, 43-49 odd, 55, 63, 99 Section 5.4 # 1, 3-6, 13, 19-59 odd, 69-75 odd, 111,
119, 121 |
MML homework for sections 5.3 and 5.4 are now available. You may get information about Final Exam Review sessions and download a copy of the Final Exam Review at the UHD Algebra Student web site http://cms.uhd.edu/qep/algebra |
|
26 |
4 - 17 |
|
Test 3 (Sections 3.2, 3.3, 4.1, 4.2, 4.4, 5.1, 5.2) Bring
a scientific calculator. |
|
Here some instructions for MWMilton: Enter Table/Find Fitting Line |
|
25 |
4 – 15 |
5.1&5.2 |
Section 5.1&5.2 Inverse functions have many properties.
(1) If the function f is one-to-one, then it has an inverse that is written
as f -1(x), read as “f inverse of x”. (2) The function f changes
x to f(x), and the function f -1 changes f(x) back to x, that is, f
-1(f(x))=x. The reverse is also true, that is, the function f
-1 changes x to f -1(x) and the function f changes f -1(x)
back to x, or f(f -1(x))=x. (3) Inverse functions swap inputs
and outputs. Study example 5 on page 387: f(height)=crutch length and f
-1(crutch length)=height. This means f(50) stands for the crutch length
needed when a person is 50 inches tall, however, f -1(50) stands
for the height of a person who needs crutches of length 50 inches. Note in
example 1b on page 383 that it is possible to think through the inverse of a
function: the function rule (x-7)/2 “subtract 7 from the input and then
divide by 2” has inverse “multiply the input by 2 and then add 7” or 2x+7. |
See below. |
MyMathLab homework assignments for Test 3 must be completed by midnight Wednesday, April 16. |
|
24 |
4 – 10 |
4.4 5.1&5.2 |
Section 4.4 The solutions to a quadratic equation
may be complex imaginary solutions: the solutions can be written to include
the number i. Study example 2 on
page 295. Note that to find the x-intercepts of a function y=f(x), you
substitute 0 for y and solve an equation. Only the solutions to the equation
that are real numbers will be x-intercepts on the graph – this means that if
all solutions to the equation are complex imaginary then the graph will have
no x-intercepts. See example 3 on page 297. Section 5.1&5.2 There are problems where the output from one
function is used as the input to another function – this is called composition
of functions. The notation g(f(x)), “g of f of x”, means to use the output
f(x) as input to the function g. Composition is also written as g◦f, “g
composition f”. Given the formulas for f and g separately, to calculate
g(f(2)): 1st, calculate the output f(2); 2nd, input the
value of f(2) into the formula for g. The formula for the composition of the
functions can be found too. Study example 7 on page 370. A function f changes a number x into f(x) – is there a way to change f(x) back to x? This is the idea behind an inverse function. Only one-to-one functions (no repeated outputs) can be reversed and will have an inverse. See the steps on page 387. |
Section
5.1 # 39, 53, 61, 63-71odd,79 Section
5.2 # 1, 3, 7, 8, 13, 15, 17, 19, 23, 25, 45, 51, 71, 72, 77, 103, 107, 122, 127 |
MML 5.1&5.2 is now available. |
|
23 |
4 – 8 |
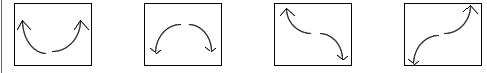
4.1&4.2 4.4 |
Section 4.1&4.2 There are four possibilities for the end
behavior of any polynomial function, looking from the origin out: the
ends go in opposite directions with the left falling and the right rising
like f(x)=x, the ends go in opposite directions with the left rising and the
right falling like f(x)=-x, the ends go in the same direction with the left
rising and the right rising, like f(x)=x2, or the ends go in the
same direction with the left falling and the right falling, like f(x)=-x2.
Click here to see sketches of the four possible
graphs. Note the four possible graphs correspond to: a polynomial with odd
degree and positive leading coefficient, a polynomial with odd degree and
negative leading coefficient, a polynomial with even degree and
positive leading coefficient, and a polynomial with even degree and negative
leading coefficient. If you plot a table of data, you can choose the degree
of the polynomial that will model the data by inspecting the number of
turning points and x-intercepts. Study problems 41-44 on page 270. Section 4.4 The complex number i equals the square root of -1 and has the property that i2=-1. The standard form
of a complex number is a+bi where a
and b are real numbers. See page 293. Also, the square root of a negative
number is a complex imaginary number: √(-a)=i√a. For example: √(-9)=i√9=3i. Complex
numbers may be added, subtracted, multiplied and divided: study pages
293-294. It is important to remember that you should substitute -1 for i2 when calculating with
complex numbers. A quadratic equation may have a complex imaginary
solution. Study example 2 on page 295. |
See below. |
MML for 4.4 is now available. Have you been contacted by UHD to
complete the NSSE survey? Click here for more
information. |
|
22 |
4 – 3 |
3.2 4.1&4.2 |
Section 3.2 The domain of a function is the set
of all x-values or the set of all input numbers for the function. If a number
is in the domain of a function, then the matching output must be a real
number. Consider problem 83 on page 203: find the domain of the function
g(t)=(5-t)/( t2-t-2). 1st, examine the function
formula: there is a variable in the denominator. 2nd, since
division by zero is not defined, set the denominator=0 to find the numbers to
omit from the domain. 3rd, the solutions to t2-t-2=0
are t=-1 and t=2. Therefore, the domain is all real numbers except -1
and 2. Section 4.1&4.2 When a graph is rising from left to right,
we say the function is increasing on the matching interval of
x-numbers. When a graph is falling from left to right, we say the function is
decreasing on the matching interval of x-numbers. Study example 1 on
page 244. A turning point occurs whenever the graph changes from
increasing to decreasing or from decreasing to increasing. If a polynomial
function has degree=n, then the function graph has n or fewer x-intercepts
and it has (n-1) or fewer number of turning points. Therefore, in
advance of seeing the graph, you can predict the most number of x-intercepts
and the most number of turning points. See problem 13 on page 269. Given the
graph of a polynomial function first, you can go in reverse and determine the
minimum degree of the polynomial. See problems 5 and 6 on page 268. The maximum
value of a function is the y-value of the highest point on the graph of the
function. The minimum value of a function is the y-value of the lowest
point on the graph of the function. When the turning point is a valley point it is also called a local minimum, and when the turning
point is a peak point, it is also
called a local maximum. Maximum and
minimum values (also called extrema) have practical importance: see problems
120 and 121 on page 255. |
Section
4.4 Complex numbers # 1-23 odd Quadratic equations # 47, 49, 51, 55 Number of real zeros # 63, 64, 65 |
|
|
21 |
4 - 1 |
3.3 4.1&4.2 |
Section 3.3 Carefully study example 1 on page 207: graphically
solve the quadratic inequality ax2+bx+c<0 by using
the graph of the related function f(x)= ax2+bx+c or y= ax2+bx+c.
1st, rewrite the problem from “find all x so ax2+bx+c<0”
to “find all x so y<0; 2nd, locate the x-intercepts x=-1
and x=2 where y=0; 3rd, note that the x-intercepts break up the
x-axis into three intervals and on each interval the matching y-values on the
graph are always positive or always negative (when x<-1, y>0, when
-1<x<2, y<0, when x>2, y>0); 4th, altogether, y<0 when -1<x<2 gives
the solution. Study the application examples: example 3 (safe speeds)
and example 5 (heart rates). Section 4.1&4.2 Constant functions, linear functions and
quadratic functions are also called polynomial functions; see page
242. Note that a polynomial function can be written as a sum of terms where
each term has the variable with an exponent that is a nonnegative integer 0,
1, 2, ...; the variable cannot have a negative exponent (appear in a
denominator) and the variable cannot have a fractional exponent (appear under
a root). The highest power on the variable is called the degree of the
polynomial and the corresponding coefficient of the term with the highest
power of the variable is called the leading coefficient of the
polynomial. See page 243 for examples. The graph of a polynomial function
is a straight line or an unbroken curve with no sharp turning points. |
Section
4.1 Polynomial functions # 3-9 odd Intervals where increasing or decreasing # 11 – 23 odd, 29, 31 Turning points # 39, 41, 43, 49, 55, 57 Application # 121 Section
4.2 Turning points # 1, 5, 7, 11, 12, 13, 15, Degree, end behavior # 19, 21, 26, Conjecture degree # 41 Piecewise-defined functions # 69, 71, 75, 77 Application # 81 |
MML
for 4.1 & 4.2 is now available. |
|
20 |
3 - 27 |
3.2 3.3 |
Section 3.2 Note that to find the x-intercepts
of the quadratic function y= ax2+bx+c, you set y=0 and get 0= ax2+bx+c,
a quadratic equation. This means the number of x-intercepts equals the number
of solutions to the quadratic equation that are real numbers: if the
parabola has two x-intercepts, then the
quadratic equation has two real number solutions; if the parabola has one
x-intercept, then the quadratic equation has one real number solution; if the
parabola has no x-intercepts, then the quadratic equation has no real number
solutions. See page 196. After you use the quadratic formula to find the
x-intercepts exactly, you can use a calculator to find the
x-intercepts approximately. See page 195 and 197. Problem 97, height
of a baseball, was discussed in class. Section 3.3 If you take a quadratic equation and
replace the = by an inequality <, >, <, >, you will
have a quadratic inequality. We will solve quadratic inequalities by
using only the graphing method. Carefully study example 1 on page 207. |
Section
3.3 Solve inequality graphically # 1, 5, 7-17 odd, 27 - 35odd, 39, 42, 45-47, Application # 61 |
MML
for section 3.3 is now available. |
|
19 |
3 - 25 |
3.2 |
Section 3.2 A quadratic equation can be written
in the form ax2+bx+c=0 where the coefficient of the square term, a,
cannot be 0. There are different methods to solve a quadratic equation: (1) solve
by factoring – one side must be a product and the other side 0 like in
example 1 on page 190; (2) solve by the square root property – one
side must be a squared quantity like x2 or (x+3)2 and
the other side must be a number like in example 4 on page 192; (3) solve
by the quadratic formula – one side must have the form ax2+bx+c
and the other side must be 0 like in example 7 on page 194; (4) solve by
graphing – study example 8 on page 195. |
Section
3.2 Solve quadratic equation # 1, 3, 5, 11, 13, 15, 19, 21 Find x-intercepts # 25, 27 Solve graphically # 31, 33 Find the domain # 81, 83 Literal equations # 93, 95, Applications # 99, 105 |
MML
for section 3.2 is now available. |
|
18 |
3 - 13 |
|
Test 2 (Sections 2.2, 2.3, 2.4, 2.5, 3.1) Bring
a scientific calculator. |
|
MyMathLab
homework assignments for Test 2 must be completed by midnight Wednesday,
March 12. |
|
17 |
3 – 11 |
2.5 3.1 |
Section 2.5 Some absolute value problems were done to
review for the test. Section 3.1 The formula of a quadratic function
can be written in the form f(x)=ax2+bx+c, where a is not zero. The
graph of a quadratic function has a shape that is called a parabola. The
formula to find the x-coordinate of the vertex is on page 177: x =
-b/2a. To find the y-coordinate of the vertex , you then substitute the
x-coordinate of the vertex into the function formula. Study example 5. Note
in applications of quadratic functions that the maximum or minimum output in
the range occurs at the vertex. Study example 9: the flight of a baseball.
Note that the scatter plot of a data set may fall more or less along a
parabola: to find the equation of the parabola, you can use the MWMilton
software on the CD. |
See below. |
|
|
16 |
3 - 6 |
2.5 3.1 |
Section 2.5 (1) A piecewise-defined function
f(x) has more than one formula; (2) each formula has a matching interval of
numbers; (3) to calculate f(x), first you find the interval of numbers that x
belongs to, second, you substitute x into the matching formula. The domain
is the union of all of the intervals of numbers that belong to each formula.
The graph consists of pieces of graphs; each formula typically adds a
distinct piece to the graph. Study example 2 on page 141. To solve an absolute
value problem using algebra, it is helpful to think of the absolute value
of a number as the distance from zero to the number on the number line. Study
example 5 on page 146 and example 8 on page 148. Section 3.1 The formula of a quadratic function
can be written in the form f(x)=ax2+bx+c, where a is not zero. The
graph of a quadratic function has a shape that is called a parabola;
the parabola will open up, a U-shape, if a>0 and will open down, a ∩-shape,
if a<0. The tip of the parabola is called the vertex and the
vertical line that goes through the vertex is called the axis of symmetry.
There is a formula to find the vertex: study page 177. |
Section 3.1 Quadratic function # 1-7 odd Graph of quadratic function # 9 – 15 odd Vertex # 17, 19, 29 Sketch graph # 59-75odd Applications # 79, 83, 85-88 |
|
|
15 |
3 - 4 |
2.4 2.5 |
Section 2.3 Another example was done in class to find
the equation of a fitting line by using the software MWMilton that is on the CD
given to every student. Section 2.4 The strategy to solve a linear
inequality is the same as the strategy to solve a linear equation: use
algebra to isolate the variable on one side of the inequality. The Properties
of Inequalities that you use to solve an inequality are on page 126: you
may add or subtract the same number from each side of an equality; you may
multiply or divide by a positive number to each side of an inequality; you
may multiply or divide by a negative number to each side of an inequality but
you must reverse the inequality. Study example 1 on page 126 to see how
inequalities are solved. Solutions to linear inequalities are often written
using interval notation: see page 125 for details. A compound
inequality or 3-part inequality is a shorthand way to write two
inequalities connected by the word and.
The goal in a compound inequality is to isolate the variable in the middle:
you must remember to add/multiply the same number to the left part, to the
middle part, and to the right part of the inequality. Study example 6 on page
130 to see how this is done. Section 2.5 A piecewise-defined function is a
function with more than one rule, but each rule is only used for certain
x-values. Study example 2 on page 141 to start understanding how piecewise-defined
functions work. |
Section 2.4 Interval notation # 1-11 odd Solve the inequality # 13 - 31odd, 35 Applications # 88, 91,101 Section
2.5 Piecewise-defined function # 3, 7, 9, 11, 15, 19, 20, 22 Absolute value # 41, 45, 51, 71, 73, 77, 79, 87, Application # 103 |
MML
homeworks 2.4, 2.5 and 3.1 are now available. |
|
14 |
2 - 28 |
2.3 |
Section 2.3 More examples were done in class of solving
linear equations using two methods: solve symbolically and solve
graphically. Study problem 49: use the graph of f(x) to solve each equation
f(x)=-1, f(x)=0, and f(x)=2. In this problem, remember that y=f(x) and to
solve f(x)=-1, rewrite it as y=-1; then find the point on the graph with y=-1
and find the matching x to get the answer. Study example 3 to review how you
can symbolically solve a linear equation with fractions. Sometimes a problem
involves table data that is approximately linear: when you plot the
table the points fall more or less along a line, but not exactly on the line.
We can find a fitting line that is the best line to capture the trend
of the data; this line is also called a best fitting line, trend line, least
squares line and regression line. The equation of a fitting line can
be found by using the computer. Each student was given a CD with freely
available graphing software: GraphCalc and MWMilton. You can use MWMilton to
find the equation of the fitting line: click here for
step-by-step instructions. |
See below. |
MML
homework 2.3 is now available. |
|
13 |
2 - 26 |
2.2 2.3 |
Section 2.2 Study problem 88 on page 103: (1) note
that this is a linear function and two points are given; (2) first, you find the
equation of the line; (3) second, you interpret the slope; (4) third, you
must use the equation of the line to find the hourly wage in 1990. Study
problem 107: remember that a direct proportion linear function has the
y-intercept b equal to 0. Section 2.3 A linear equation can be written in
the form ax+b=0; see page 107. This means a linear equation has a highest
power of 1 on the variable, and there can be no variable in a denominator and
there can be no variable under a root √. Linear equations can be solved
by using the addition property of equality and/or the multiplication
property of equality. See page 107. Linear equations can be solved by
hand (also called “solve symbolically” or “solve analytically”). Also,
linear equations can be solved graphically (also called “intersection-of-graphs
method”). Study example 5 to see how an equation is solved graphically. |
Section
2.3 Is the equation linear? # 1, 3, 5 Solve symbolically (by hand) # 17 – 25 odd Solve graphically # 49, 57, 63 Applications # 84, 86, 88, 96, 112 |
|
|
12 |
2 - 21 |
2.2 |
Section 2.2 The reciprocal of 2 is ½, and the negative
reciprocal of 2 is -½. Similarly, to find the negative reciprocal of
any nonzero number a: 1st, form the reciprocal 1/a, and 2nd,
change the sign, -1/a. Carefully study example 6 – find the equation of a
line parallel to a given line and passing through a given point, and
example 7 – find the equation of a line perpendicular to a given line
and passing through a given point. Remember that to find the slope-intercept
form of a line: 1st, find the slope m, and 2nd, find
the y-intercept b. There are two special cases of a linear function
f(x)=mx+b: (I) when the slope is 0, the formula is f(x)=b which is called a
constant function; (II) when the y-intercept is 0, the formula is f(x)=mx
which is called a direct proportion (direct variation) function. In a
direct proportion function, it is common to use k for the slope and to call
it the constant of proportionality. Note that for a direct proportion
function, only one point different from the origin is needed to find the
slope/constant of proportionality, because you already know that the line
goes through the origin (0,0). Study pages 96 and 97. |
See below. |
|
|
11 |
2 - 19 |
2.2 |
Section 2.2 To find any x-intercept, let y=0 in
the equation and solve for x. To find any y-intercept, let x=0 in the
equation and solve for y. See page 91. The equation of a horizontal line
can be written in the form y = b, where b is the y-intercept. The equation of
a vertical line can be written in the form x=k where k is the
x-intercept. See page 92. The most import form for the equation of a line is
the slope-intercept form, but there are other forms such as the
point-slope form and standard form. Carefully study the examples: example 1 –
find the equation of the line passing thru two given points; example 2 – find
the equation of a line with a given slope and passing thru a given point;
example 6 – find the equation of a line parallel to a given line and passing
through a given point; example 7 – find the equation of a line perpendicular
to a given line and passing through a given point. Note: parallel
lines that are not vertical have equal slopes, see page 92; and perpendicular
lines have slopes whose product is -1 if the lines have nonzero slopes, see
page 93. |
See below. |
MML
homework 2.2 is now available. |
|
10 |
2 - 14 |
|
Test 1 (Sections 1.1, 1.2, 1.3, 1.4, 2.1) Bring
a scientific calculator. |
|
MyMathLab
homework assignments for Test 1 must be completed by midnight Wednesday,
February 13. |
|
9 |
2 - 12 |
2.2 |
There
was discussion about the sections to be covered on test 1 and some of the
types of questions that could be on the test. Section 2.2 In this section, you get more practice
with writing the equations/formulas of linear functions. The variable name
“m” is often used for the slope of a line. This means the formula of a linear
function can be written as f(x)=mx+b = (slope)x+(y-intercept). This is called
the slope-intercept form of a line. See page 89. To use this formula
in a problem, you must be given enough information to find the slope and the
y-intercept. There is a common key step in many of these problems: if
a point (x,y) is on the graph of a line, then substituting for x and y into
the formula gives a true equation. Carefully study the examples in section
2.2. |
Section
2.2 Find the equation of a line # 1-31odd, 35, 39- 55 odd Determine the intercepts # 61, 63, 75 Applications # 81, 84, 87, 99, Direct proportion # 101,103-107 |
|
|
8 |
2 - 7 |
1.4 2.1 |
Section 1.4 One special case of a linear function
f(x)=ax+b is when a=0; the formula is then of the form f(x)=b where b is a
real number. This type of linear function is called a constant function.
For example f(x)=1 is a constant function; the output is constantly 1. This
means f(-2)=1, f(0)=1, f(a)=1, etc. The graph of a constant function is a horizontal
line. The slope of a constant function is zero. Study pages 46-47.
Section 2.1 Remember that for a function y=f(x), that
is, the output f(x) is the y-value when you graph the function. To find the x-intercept
of a function, set the output y=0; and to find the y-intercept of a
function, set the input x=0. Note that this means f(x)=ax+b=(slope)*x+(y-intercept)
and so you can just read off the y-intercept by visual inspection of the
function formula. For example, the linear function f(x)=2x+1 has
y-intercept=1. In application problems, the intercepts may have practical
meaning – study example 4 on page 76. If the output in a word problem has a
constant rate of change, this means the problem involves a linear function:
f(x)=(constant rate of change)*x+(initial amount); the sign of the constant
rate is positive if the output is increasing and the sign of the constant
rate is negative if the output is decreasing. Study example 5 on page
77. Algebra review: To solve the equation (2/3)x=6 you may multiply
both sides by 3/2, the reciprocal of 2/3. Get-out-of-class
activity 3 was done in class today. |
See below. |
|
|
7 |
2 - 5 |
1.4 2.1 |
Section 1.4 The slope of a line gives geometric
information about the line: (1) a line with positive slope rises from
left to right; (2) a line with negative slope falls from left to
right; (3) a line with zero slope is horizontal; (4) a vertical line
has undefined slope. Another interpretation of slope is rise/run,
that is, the slope gives the directions in two steps to get from one point on
the line to another point on the line, where rise gives the amount of up-down
movement and the run gives the amount of left-right movement. The slope of a
line can be interpreted as a rate of change: the slope tells you how y
(output) changes per unit increase in x (input). For example, the linear
function f(x)=3x+4 has slope 3: This means y increases 3 units per unit
increase x OR The line rises 3 units per unit increase in x. In applications,
the slope units are the “y units” per “the x unit.” For example, Sheila’s
weekly salary in dollars (output unit is dollars) is a function of the number
of clients she has (input unit is number of clients), and so the slope units
are dollars per client. In applications, to interpret the slope means
to write a sentence that gives the practical
meaning of the slope. In problem 30, the number of banks (output) in year
t (input) is given by the linear function N(t)=-458t + 973769, from 1987 to
1997. The practical meaning of the slope is “The number of banks is
decreasing by 458 banks per year during this time” or “The number of banks is
decreasing by 458 for each additional year during this time.” Read ahead
about constant functions. Section 2.1 Note in a linear function f(x)=ax+b that
f(0)=a(0)+b=0+b=b and so we say b is the initial amount, of the output. In
applications, the formula of a linear function can be remembered as f(x) =
ax+b = (constant rate of change)*x + (initial amount). For example,
Sheila’s base salary is $100 (initial amount) and her salary increases by 8
dollars per client (constant rate of change), and so the function formula for
her salary is f(x)= (constant rate of change)*x + (initial
amount)=(8)x+(100)=8x+100. Alltogether then, in any function problem where
the output quantity changes at a constant rate, we can model the problem with a formula that has the form f(x)=ax+b.
Study the examples in section 2.1. |
Section
2.1 Is the table linear, exactly or approximately? # 1, 2, 3 Determine the slope, intercepts and write a formula for the linear function # 5, 8, Graph the linear function # 13, 15, 21, Write a formula for the linear function # 25, 27, 30, Application # 37-40, 41, 44, Write a formula for the linear function # 49, 51, Approximately linear data # 53,55 |
|
|
6 |
1 - 31 |
1.3 1.4 |
Section 1.3 For the functions we are currently
studying, if the function formula has no variable in a denominator and the
function formula has no variable inside a square root, for now, you may
assume the domain is the set of all real numbers. Section 1.4 A rate of change between two
quantities relates how the quantities change in comparison to each other: 60
miles per hour, 3 dollars per gallon, 5 points per hour studied, etc. A linear function has many key
properties: (1) the formula can be written in the form f(x)=ax+b; (2) in a
table, if the inputs are equally spaced, then the outputs are equally spaced;
(3) the function has a constant rate of change. The constant rate of change
is also called the slope of the function. The slope equals the coefficient
of x in the formula f(x)=ax+b. The slope can also be found from any two
points on the graph of a linear function: slope = (y2-y1)/(x2-x1)
= Δy/Δx where Δy denotes the change in y and Δx
denotes the change in x. Study all the examples in section 1.4. Get-out-of-class
activity 2 was done in class today. |
Section
1.4 Calculate slope from points # 3, 5, 13, Find slope from function formula # 17, 19, 21-25 odd Find slope from function graph # 27 Interpret slope # 29 Is the table linear # 33, 34, 35 Is the function linear # 37, 41-49 odd, 53, 55, Write a formula # 62-64, 66, 67, Curve sketching # 69 Writing problem #104 |
MML
Homework 1.4 is now available. |
|
5 |
1 - 29 |
1.3 1.4 |
Section 1.3 To find the domain of a function that has a
variable under a square root, you set the expression under the square
root (the radicand) greater than or equal to 0. Hence, to find the domain of
f(x)=√(x-1), you solve x-1>0, and so the domain is x>1.
For a function graph: (1) a number on the x-axis is in the domain of
the function if a vertical line through that number touches a point on
the graph; (2) a number on the y-axis is in the range of the function
if a horizontal line through that number touches a point on the graph. Section 1.4 The most important special type of
function is a linear function. Read ahead: How can you tell from a
graph if the function is linear? How can you tell from a formula if the
function is linear? How can you tell from a table if the function is linear?
How can you tell from a word problem if the function is linear? |
See below. |
|
|
4 |
1 - 24 |
1.3 |
Section 1.3 These are equivalent statements:
(1) y = f(x); (2) y is a function of x; (3) the value of y depends on
the value of x; (4) there is exactly one y-value for each x-value. Note that
in a function, when we start with an x-value (quantity at end of sentence),
then we can find exactly one y-value (quantity at beginning of sentence). It
is correct to say that the time of day is a function of a person’s location
on earth since given the location there is exactly one matching time of day.
It is not correct to say that the location on earth is a function of the time
of day since given the time of day there is not exactly one matching location
on earth. For a function graph, y=f(x): (1) to find f(0) you know x=0
and you must find the y-value of the matching point ; (2) to find x where
f(x)=0 means you know y=0 and you must find the x-value of the matching
point. For a function formula (symbol rule), a number is included in
the domain if the matching output is a real number. So the function
f(x)=1/x includes x=5 in the domain since the matching output f(5)=1/5 is a
real number. However, f(0)=1/0 is not defined so x=0 is not in the domain. To
find the domain of a function that has a variable in a denominator, you
should set the denominator equal to 0, solve this equation and exclude these
numbers from the domain. Study example 3 on page 34. Read ahead in example 5
on how to find the domain and range of a function graph. Get-out-of-class
activity 1 was done in class today. |
See below. |
MML
Homework 1.3 (part 1 and part 2) is now available. |
|
3 |
1 - 22 |
1.3 |
Section 1.3 Some relations are stronger than others – if
each x-value is matched with exactly one y-value, the relation is also called
a function. For a graph relation, if each vertical line touches
the graph at most once, this means each x-value is matched with exactly one
y-value and so the graph is a function. But, if some vertical line touches
the graph more than once, this means some x-value has more than one y-value
and so the graph is not a function. Function notation: if the function
f matches the input x with the output y, we write y=f(x) read as “y equals f
of x.” Hence f(2)=3 means the x-value 2 is matched with the y-value 3. Note
too that f(x) stands for the output when the input is x. Functions, Points
and Graphs on page 32: If f(a)=b then the point (a,b) lies on the graph
of f. Conversely, if the point (a,b) lies on the graph of f, then f(a)=b. A
function formula such as f(x)=2x+3 can be written with empty parentheses as
f( )=2( )+3 to remind you that the same value is substituted all the way
across the equation. That is, f(0)=2(0)+3=3 and f(a)=2(a)+3=2a+3. You must
practice learning to identify functions and to use function notation. |
Section
1.3 Functions and points # 1, 3 Graph by hand 5, 9, 13, 15, 21, Evaluate function notation # 23-33, odd Determine the domain # 37-49 odd Find all x so f(x)=0# 53, 55, 57 Verbal, graphical, numerical # 63, 64 Write as set of ordered pairs # 71 Interpret # 75 Determine if the graph is a function # 79, 81 Determine if S is a function # 87-99 odd |
MML
Homework 1.2 is now available. Free
tutoring help for our course is available in the Math Lab. |
|
2 |
1 - 17 |
1.1 1.2 |
Section 1.1 A calculator can be used to calculate any
root, by first rewriting the root with exponents: the nth root of x
equals x to the power (1/n). For example, to calculate the cube
root of 5, enter 5^(1/3) in your calculator. Negative exponents
indicate reciprocal, i.e., 2-3 = 1/23 = 1/8. The
formula to find the percent change in a quantity from value P1
to value P2 is on page 4; also, see example 4 on page 4. Section 1.2 A relation can be written as a set
of ordered pairs (x,y). The domain of a relation is
the set of all x values. The range
of a relation is the set of all y
values. A relation can also be written as a table, and a relation can also be
graphed. The graph of a table is called a scatterplot. See examples 3,
4 and 5 on pages 16-18. A viewing rectangle or viewing window
tells you the smallest number (Xmin) and the largest number (Xmax) on the x-axis
and the distance between tick marks on the axis (Xscl); it also tells you the
smallest number (Ymin) and the largest number (Ymax) on the y-axis and the
distance between tick marks on the axis (Yscl). This is written altogether as
[Xmin, Xmax, Xscl] by [Ymin, Ymax, Yscl]. See pages 22 – 23. |
See
below and Section 1.2 Write the table as a set relation # 9, 11 Find the domain and range, and plot the relation (draw a scatterplot) # 61, 63, 65, 67, By hand, draw the viewing rectangle (viewing window) # 69, 71 Draw a scatterplot # 81, 83 |
|
|
1 |
1 - 15 |
1.1 |
You
should be able to describe the following sets of numbers and recognize
when a given number belongs to one of the sets: (1) the set of natural
numbers; (2) the set of integers; (3) the set of rational
numbers; (4) the set of irrational numbers; (5) the set of real
numbers. Study the descriptions on page 2. Note that every natural number
is an integer; every integer is a rational number; every rational number is a
real number; every irrational number is a real number; every real number can
be plotted on the number line. An important application of sets of numbers is
to state the set of numbers that is most appropriate to describe the
possible values of a given measureable quantity. Study exercises 13 – 18 on
page 11. |
Section 1.1 Classify the number # 1, 2, 3, 5, 7, 11, 13, 15, 17 Find the percent change # 19, 21, 95c Use a calculator # 69, 70 |
Please
register in MyMathLab as soon as possible. MML
Homework 1.1 is now available. |